The Dilernia
Model and Methodology
seeks to understand the market forces that is driving price right at this
moment in order to predict what might happen in the future. This enables the
trader to better understand the strength of the trend and how long it might
last for, or whether a change of trend is at hand.
A trader
should analyse the market using the ‘Sequential ordering of pattern
formations ’. This process is extremely important because it strengthens
the reason for any trade taken, or why the trade should not be taken. This is
when the trader optimises any potential trade now or in the future, and how
best to manage the trade during the current market conditions.
Sequential ordering of pattern
formations #
1. Apply the trend identification
Model.
2. Identify support, resistance, and
trends
3. Identify the change of support &
resistance with the use of Time.
4. Forewarn & foretell the likely
events when certain price action occurs now or in the future.
Optimising to the current market
conditions
1. The decision to Buy, Sell, or not
trade
2. Trade execution
3. Trade Management.
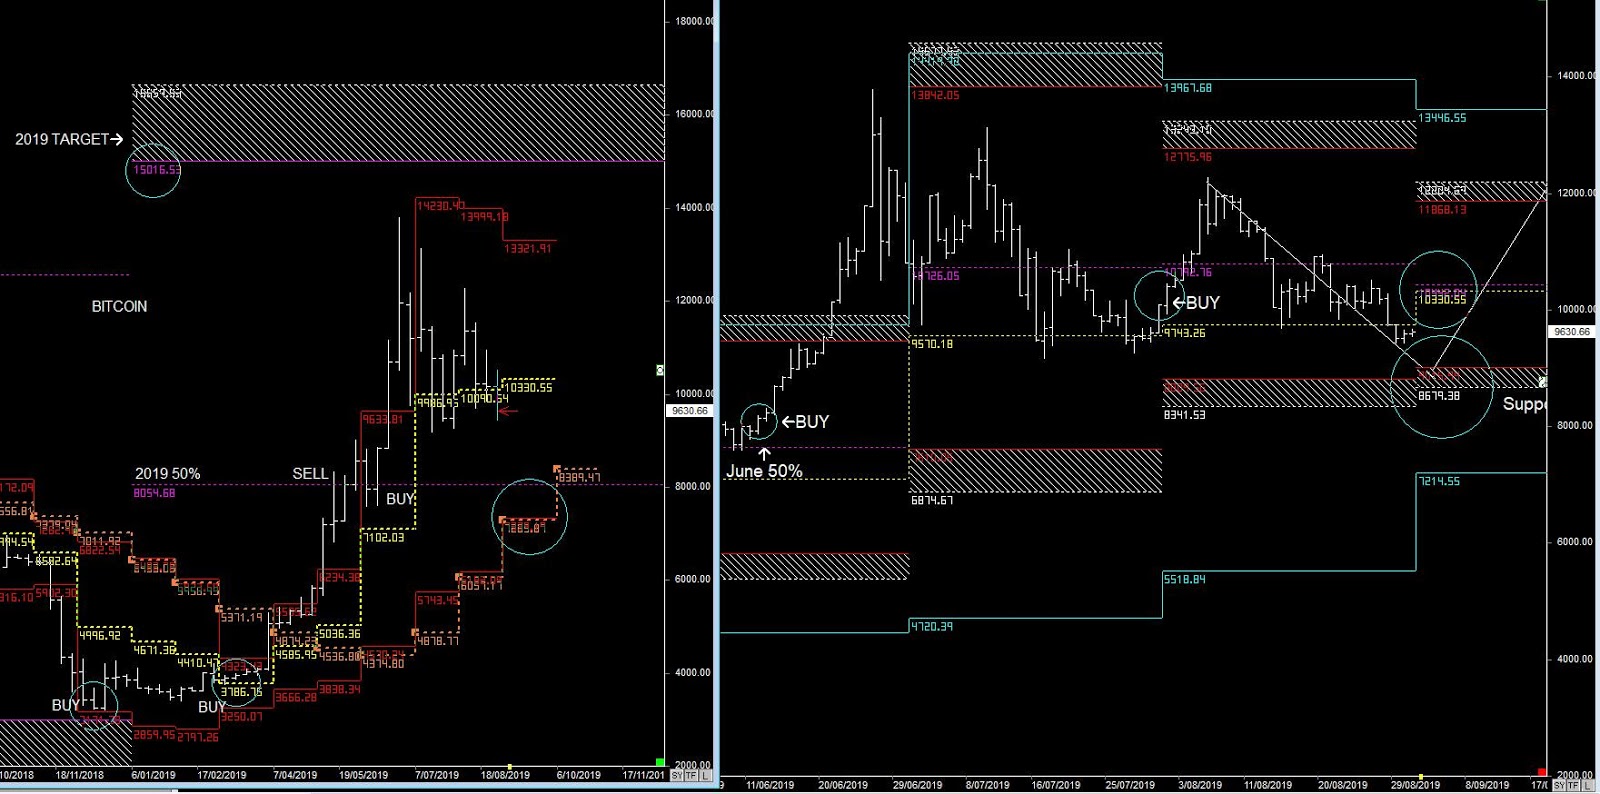
BITCOIN PRIMARY & WEEKLY CYCLES
I’ve posted the above because it
gives us an idea how the price action is not always what it seems to be. I’ve been extremely bullish on BITCOIN since
the bottoms in the Primary trends and subsequent continuation upwards in March this year.
I’ve been bullish every month
since, but in the last report I flagged a potential downward move because of the price action
in ALTCOINS, which wasn’t appearing in BITCOIN at the time.
So where are we now?
Whilst ALT COINS aren’t trading
above their Primary 50% levels, BITCOIN has now found support around its 50%
level at 8050.
Therefore, the key price action
in BITCOIN looks to be occurring in October, but maybe not until the start of
next week.
BITCOIN needs to find support
around the October lows (7285) and then be back above 8390 the week of the 7th
October.
Otherwise expect further
weakness, which is what occured in ALT COINS
As always, look for 5-day pattern
set-ups for entry, as described in the book.