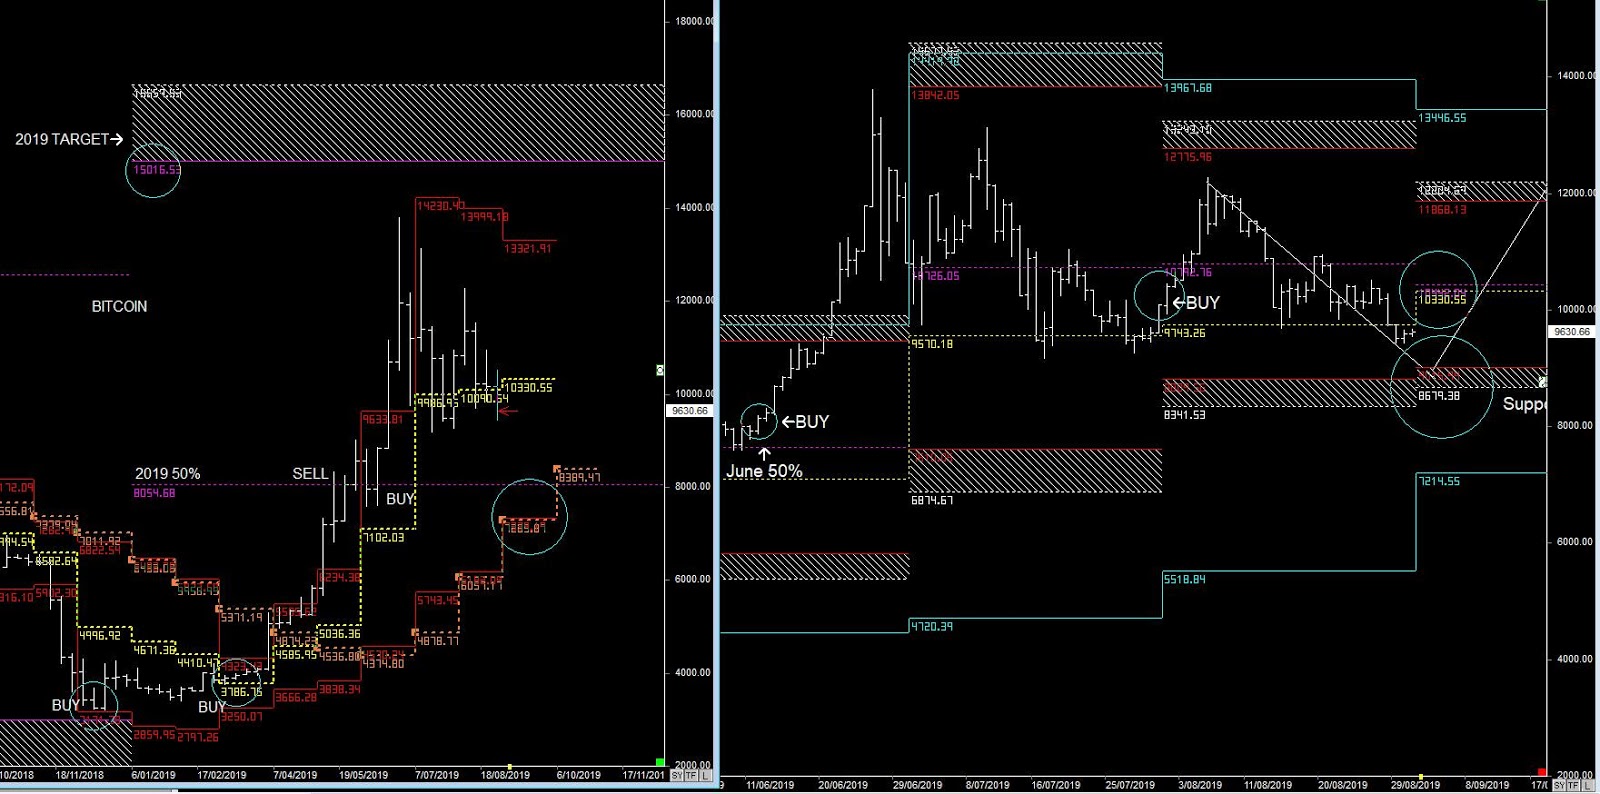
BITCOIN Primary & Secondary Cycles
Looking at the price action now compared to 2018, we are in the same position that may result in another breakout of the Secondary lows and continuation down into the DECEMBER LOWS and next BUY zone (22nd Nov Report)
We've had a similar pattern occur this November- December, as was the case in 2018, a breakout of the November lows and push down into the DECEMBER Lows & Support.
The question now remains now...
1. Do we have another 2 months sideways pattern into March 2020, struggling to get above 8050 and the 2019 50% level
2. Or does it shoot back up into the DECEMBER LEVEL (Yellow) and we then keep an eye on price action around January's 2020 50% level.
Primary & Secondary Trends remain bearish.
December lows are counter-trend buying opportunities using the 5-day cycles as guides - Entry / Exit/ Stops